
Sun Spot Cycle Prompts Fears of Global Cooling
February 13th, 2008Yet again my religious faith in Anthropogenic Global Warming has been shaken to its core by the power of Conservative Science. Witness the headline appearing on the Drudge Report last week:
“Sun’s ‘disturbingly quiet’ cycle prompts fear of global COOLING…”
The article in question points out that there is nothing to show CO2 variations have any effect on climate:
R. Timothy Patterson, professor of geology and director of the Ottawa-Carleton Geoscience Center of Canada’s Carleton University, says that “CO2 variations show little correlation with our planet’s climate on long, medium and even short time scales.”
I simply cannot dispute this statement. In fact, the following graph based on the New Antarctic Ice Core Data starkly illustrates this complete and utter lack of correlation:
|
400,000 year CO2-Temperature Correlation |
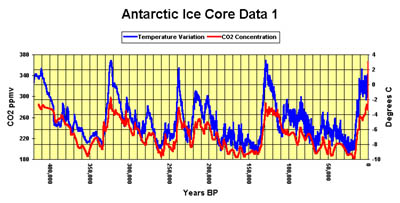
As anyone can plainly see, the line representing the Atmosphere’s CO2 is bright red, while the line representing the Earth’s Temperature is a vivid blue. The difference is plain as black and white… or red and blue, obvious to anyone. Well… obvious to anyone who isn’t colorblind or otherwise blind, like maybe ideologically blind like all those silly tree-hugging hippies who can’t even read a graph they’re so busy hugging trees and stuff. I bet they even wanna marry a tree, they love them so much (That’s why they support gay marriage, it’s a gateway to vegisexuality).
All of this irrational focus on demonizing CO2 has blinded the world to the real threat, sun spots:
Solar activity fluctuates in an 11-year cycle. But so far in this cycle, the sun has been disturbingly quiet. The lack of increased activity could signal the beginning of what is known as a Maunder Minimum, an event which occurs every couple of centuries and can last as long as a century.
Such an event occurred in the 17th century. The observation of sunspots showed extraordinarily low levels of magnetism on the sun, with little or no 11-year cycle.
This solar hibernation corresponded with a period of bitter cold that began around 1650 and lasted, with intermittent spikes of warming, until 1715. Frigid winters and cold summers during that period led to massive crop failures, famine and death in Northern Europe.
Unlike the imaginary correlation between CO2 levels and the global mean temperature, there is a real-life actual honest-Abe indisputable correlation between sun-spot proclivities and temperature:
|
Temperature, CO2, and Sunspots |
Sure the sunspot line is gold and temperature red, but notice how cool those two lines look. The sunspot and temperature lines have squiggly lines over them that make them dynamic, exciting, attention-grabbing. These are two lines that have a lot in common with each other, and bear no resemblance to that drab blue CO2 line. Hmph. Nobody but silly, uneducated liberals could find meaning in a boringly gradated line like that.
And if that doesn’t convince you then check out these peer-reviewed journal articles (or just their summaries) on sunspots and temperature correlations here, here, and here. Makes all those tree-sex-having people seem pretty silly huh? I mean, even sillier than the vegetable sex makes them seem.
PS - Exxon, can I get my check now?


You don’t seem to want to understand what the natural theorists are saying about the climate, but I am going to try to explain to you what is happening whether you want to hear it or not. Its telling that you use a chart over the last 120 years to illustrate the sun spot relationship, but choose a chart spanning 100s of thousands of years to illustrate the CO2 relationship. Never mind that its a well known and established fact that CO2 levels increase after a warming event, and since the future cannot effect the past its logical to assume that the natural warming and cooling cycles of the Earth can increase and decrease the concentration of CO2, but it is unclear whether further concentration of CO2 has any effect on Warming.
None the less, you should have gleemed enough information from the Drudge report to understand that natural theorists are saying that the Global Temperature is going down, and indeed Global Temperatures have dropped considerably by anyone’s measure. James Hansen’s GISS reports that Globally temperatures have fallen 0.75 degrees over the last year, which coincides with both the solar minimum and the La Nina event in the Pacific.
Between 1998 and 2000, we had another La Nina event, and temperatures around the World fell, but that La Nina lasted longer than the present event and occured at the solar maximum; however temperatures did not fall as much during that event as they have at present, despite the increase in CO2.
Historically, temperature lags behind a La Nina event by about 2 months, so the anomilies recorded through the Spring might be even cooler. Right now it might be easy to write off the current cooling trend as part of the La Nina, but the present La Nina is part of a larger long term climatic event known as the Pacific Decadal Oscillation (PDO). In 1978 the PDO entered into a warm phase, where LA Nina events became more common and more intense, now the PDO has shifted into a cold phase where La Nina’s will become more common. All of the warming observed since 1978 can be attributed to this cycle in the PDO.
Given the historic relationship between the solar cycles, the PDO and the known relationship between Global Temperatures and the El Nino Southern Oscillation, I can predict with a high degree of certainty that Globally Temperatures will decrease over a period of the next couple of years, and will not rebound to what we have seen over the last decade.
No longer is this something that you have to accept on faith, because it is happening right now, and through your own objective observations you can witness the evolution of this cooling trend. No longer is there a need to make snarky sarcastic blog entries about how foolish conservatives are, or wrap yourself in a cloak of Science. Science is all about making a hypothesis, then testing it through observations.
Global Warming stopped back in 1998, currently we are cooler than the long term average. Natural Climate change theories say that the Earth is going to get cooler, CO2 theorists say that the Earth is going to get warmer. One side is going to be proven correct very soon, and right now with the World cooling rapidly, I think that the evidence is on the side of the Natural Theorists, not the Al Gore Sheeple.
If you are interested please follow this link and upgrade your copy of Google Earth so that you can monitor the Climate in realtime.
http://www.gearthblog.com/blog/archives/2007/08/best_storm_tracking_and_weather_tools_for_google_earth.html
The World Meteorological Organization (WMO) doesn’t grok with your assertions. The decade of 1998-2007 is the warmest on record, Top 11 Warmest Years On Record Have All Been In Last 13 Years. 2007 has now tied for Earth’s second warmest.
I’m not sure how Drudge has convinced you that the hottest decade on record being the most recent is evidence that warming stopped in 1998… or where you’re getting any of your assertions since you don’t reference any of them. I’m sorry, but I don’t take people on their word when it comes to science, I need to see graphs and references to published peer-reviewed journal articles to convince me.
That’s science.
Ryan,
the 1998 issue arises because 1998 was very warm and since then the years have been cooler. Note I am saying that they are cooler, not that there is cooling. Basically this is an angle being pushed by people who either don’t understand how trends work (including outliers like 1998) or do understand it but lie. For whatever reason.
I have been looking at the sunspot angle for a looong time and it just carries no water. And this is from someone who could save his whole area of science in the UK if he turned around tomorrow with proof that it is all the sun. But it isn’t. The sun is the ultimate driver of climate, but it is not responsible for the bulk of climate change that is happening now.
Too many people fixate on the first point. The thing is that the folks who claim that the AGW proponents are ignoring the sun demonstrate their ignorance. The sun is factored into everything, the thing is that it cannot explain what is happening on its own.
When folk go on about past warmings (’where were all the coal and oil burning plants back when the Earth was warmer?’) they are not showing how clever they are, they are demonstrating their wilful ignorance in a most public fashion - I often feel embarrassed for them.
In the past the sun has been responsible for significant warmings, but that was in the past (and will happen again in the future). Acknowledging that one thing can have a major effect at one time does not refute the mountain of evidence that a different thing is having an effect now! but people seem to be completely blind to this. It is very sad.
To be clear, the sun IS having an effect now and this will appear in the variations of the trend. BUT the sun is not having the BIGGEST effect now. That is being caused by an over-revved greenhouse effect, caused by us. Now if the sun does enter an unusually quiet period (and I don’t think we are entering a Maunder minimum-type period, this is just solar minimum) then that is good, it gives us a tiny (miniscule) amount of breathing space to deal with the problem as the combined CO2 and solar effect will reduce. The problem is with the ever increasing CO2 effect - which is dominant!
Rant over
Thank you Kav! I really appreciate you posting your expert opinion to this thread. What you’ve said about the Maunder Minimum matches what I’ve read.
You guys may not be able to get funding for Global Warming research, but you can certainly hype the damage this solar cycle does to our world’s satellites and communications systems! Work that angle! (Seriously though, I’m really sorry about what you scientists in the UK are dealing with right now with your funding crisis. I’ve been following it on your blog and it’s unacceptable.)
There is all this talk about the rise in carbon dioxide level causing global warming. To conclude this, one must ignore that the planet plunged in to the Andean-Saharan ice age 440 million years ago when the atmospheric carbon dioxide level was over ten times what it is now.
Thanks Ryan. It’s an uphill fight. Have you seen the latest stuff on space technology and MoonLITE. Looks as if the government is trying to form a technology base at the expense of our science base. Crazy. Funny thing, look and see who is both the head of STFC and the chair of the ruling council of BNSC who have published the joint NASA report…
Dan, sorry but that is poppycock. Have you perhaps considered all the other variables that may be different between then and now? The climate scientists do. Too many folk assume that all they think about in their measurements and modelling is CO2 whereas in fact they consider all the forcings that we understand - greenhouse gases, solar forcing, orbital forcing, etc.
I am not personally familiar with the event you mention but I bet that if you spoke to a climate scientist about said event they could break down the differences between then and now to you.
Ryan,
You know what always annoys me in cases like this. Just for one moment let us assume that the climate is cooling, and has been since 1998. Let us also assume that we are entering a Maunder minimum-type period. All those making those claims now will claim vindication and it will be a triumph for sloppy analysis and ignorance. Because even if they turn out to be correct, basing that conclusion on 10 years of data (i.e. from 1998) in estimating a long-term trend is completely wrong. But we can never get them to see that because so many just don’t get the maths involved and have no interest in learning.
Dan,
There aren’t any links to credible sources to support your statements. I’ve been kind enough to show you where I’m getting my data. Show me where you are getting your information. I don’t argue with people who don’t provide links to credible sources.
Kav,
I feel your pain. : )
[...] It’s Another Global Cooling Report! March 5, 2008 I’m sure this one, unlike the last one and the one before that is for really real this time. Really. This one even made Digg, Drudge, Faux [...]
[...] due to changes in this cycle are miniscule, about 0.07% according to these guys. At least this guy has a sense of humour… and sums things up pretty [...]
I am an agnostic on the solar activity/global climate deal, but doesn’t it look, on your Antarctic Ice Core graph, like the warming temperatures precede the CO2 increases? Doesn’t this go against the Goreacle’s preachings?
I didn’t see Al Gore’s name anywhere in the article I linked to. I’m not sure where you got that.
There is a correlation between CO2 levels and global mean temperature. Scientists have theorized a causation through observing the greenhouse effect. The moment dittoheads publish a peer-reviewed paper explaining why it’s actually higher temperatures increasing CO2 levels, we’ll be happy to debate the merits of their hypothesis.
Until then, sorry, you got bumpkis.
I am saying that increasing temperatures due to natural fluctuation might have increased the amount of atmospheric CO2 by decreasing the oceans’ ability to hold CO2 in solution, causing outgassing. Thus the rise of CO2 levels before the modern age might have been an effect of rather than a cause of the warming. I have read that some of the ice core work suggests that the CO2 rise followed temperature increases.
When you come up with a mechanism to support your hypothesis and publish it in a peer-reviewed journal, I’ll entertain it. Until then, it’s just unproductive speculation.
[img]http://upload.wikimedia.org/wikipedia/en/thumb/7/7b/Temp-sunspot-co2.svg/600px-Temp-sunspot-[/img]
did you bother to look at the distinct correlation between co2 and temps for the past 2 decades??? and the distinct miss-correlation to sunspots and temps.
[img]http://upload.wikimedia.org/wikipedia/en/thumb/7/7b/Temp-sunspot-co2.svg/600px-Temp-sunspot-[/img]
Dear ideonexus,
I believe Princeton have done some work on the ability of water to hold CO2.
Alternately you could take two(unshaken) cans of Coke and put one in a warm place and the other in the fridge. When they have assumed the temperature of their environments open them both and see whch one fizzes the most!!