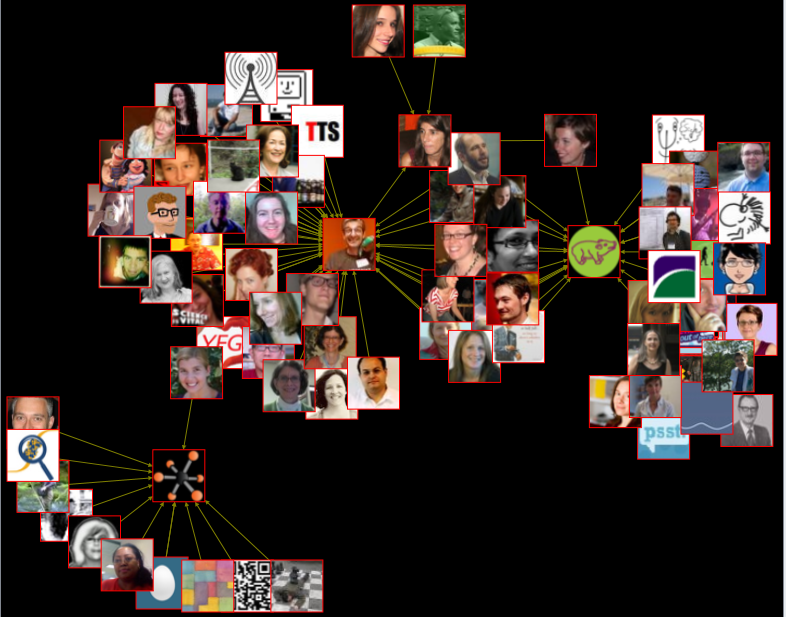
Social Networking Results for #scio11 Hash Tag on Twitter
(Click to Enlarge)
The above image is just one graph of the many tweets related to the Science Online 2011 Unconference. I generated the above graph using the open-source free software NodeXL, a Microsoft Excel plugin that harvests social networking data from common online sources and provides a variety of mean for analyzing it. In the following post, I’ll provide a brief overview of social network mapping with NodeXL using data harvested from Facebook and Science Online 2011 tweets and provide directions for making your own social network maps, where you can explore and manipulate the data to find your own insights.
Quick Overview of Social Network Graphing Using Facebook Data
I’m starting with a Facebook example, because it will merely map the inter-relationships of my friends, a much smaller and more manageable dataset than the thousands of relationships twitter produces. If you want to experiment with NodeXL network mapping, I highly recommend starting with your Facebook network for simplicity and saving CPU cycles.
My Facebook Friends, Vicky Highlighted
(Click to Enlarge)
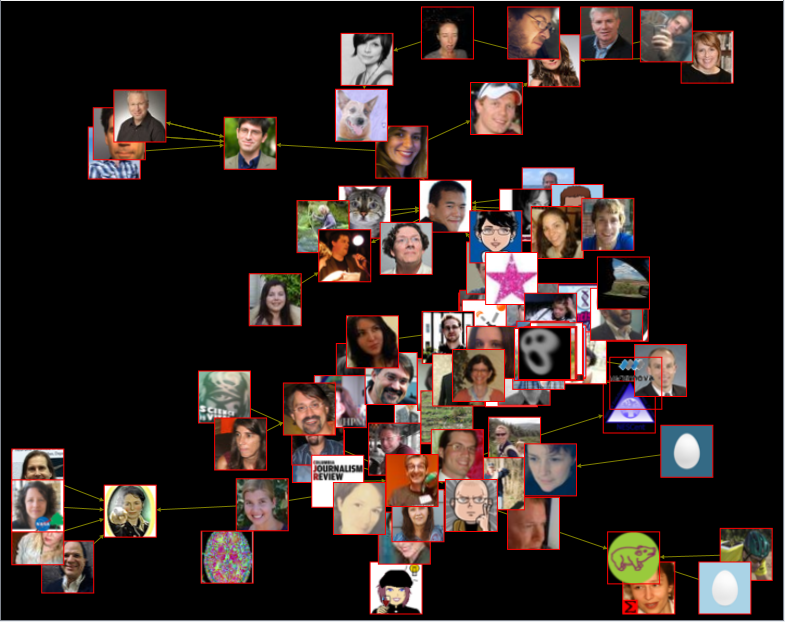
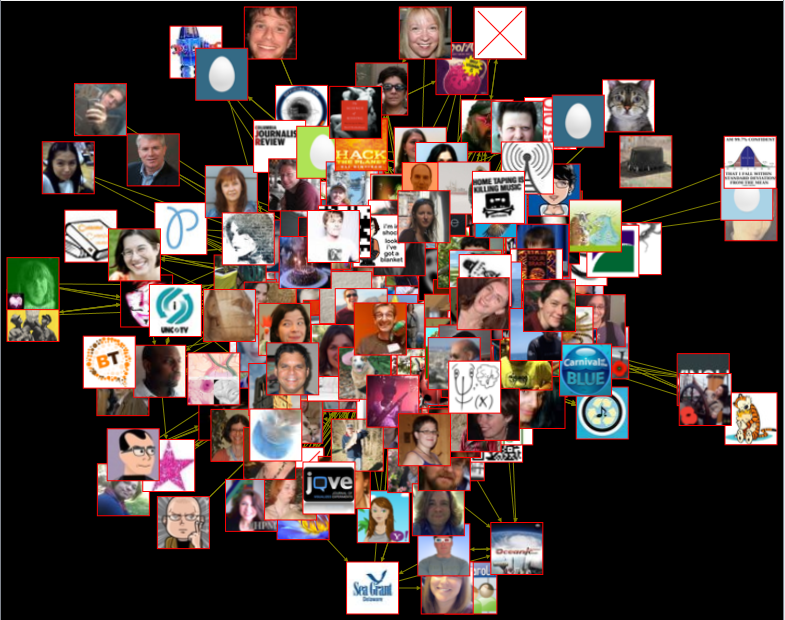
The map above is known as an “Egocentric graph,” because it lists all the people I am friends with on Facebook. The data was made available via the Name Gen Web Facebook app, which enabled me to download all of my Facebook friend data as an XML file and see who was connected to who. I’ve highlighted Vicky because, as my wife and best friend, she appears at the center of the graph, connected to everyone I’m connected to.
My Different Social Groups, Science Online Highlighted
(Click to Enlarge)
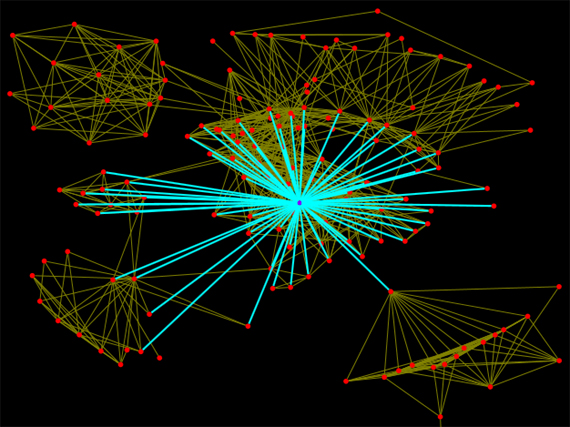
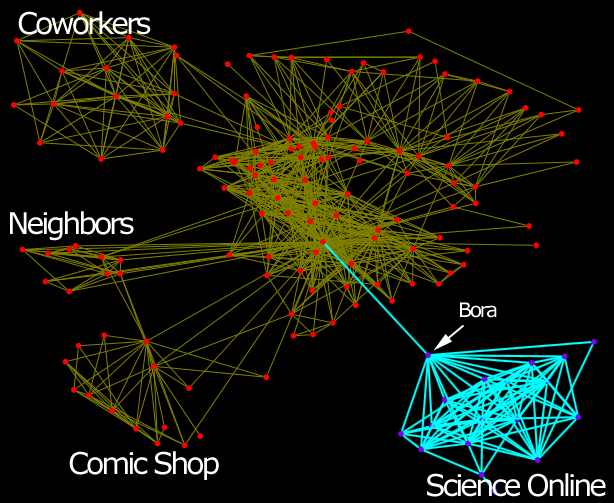
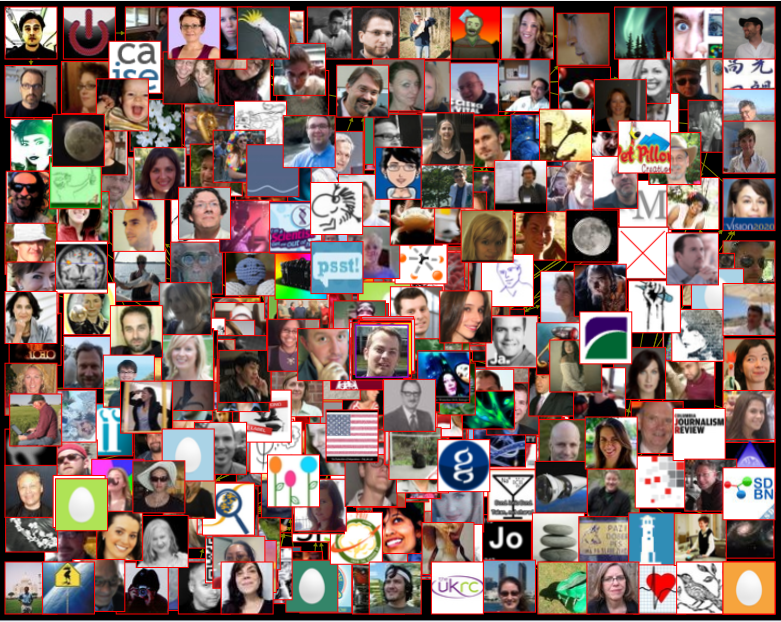
Using the Harel-Koren Fast Multiscale graphing option sorted all the people I am networked with into easily recognizable groups. The highly interconnected group of people immediately surrounding Vicky consists of my family, high school, and college friends. Outliers to my inner circle are people who I know through more purposeful means. They are my coworkers, neighborhood kids, fellow gamers, and people I know through Science Online.
With some groups, there is someone who stands out as the glue keeping the group together. For my gaming friends, that person is the owner of the comic shop, for Science Online, it should come as no surprise that it is Bora Zivkovic.
Bora-Centric Scio11 Twitter Graph
(Click to Enlarge)
Mapping the Science Online 2011 Twitter Feed
While my ability to map the Facebook network can only go as far as those people to whom I am personally connected, Twitter provides a delightful opportunity to map a network of connections that includes people I am not connected to.
#scio11 Hash Tag
(Click to Enlarge)
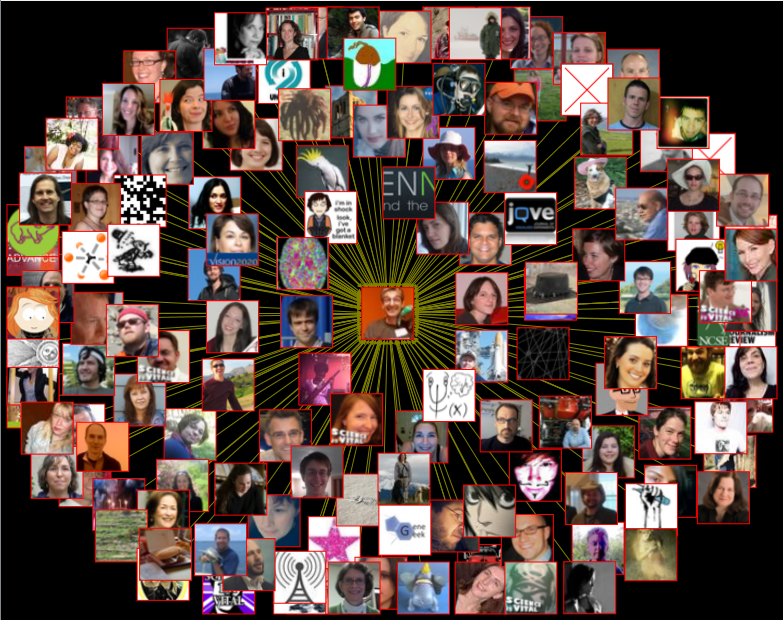
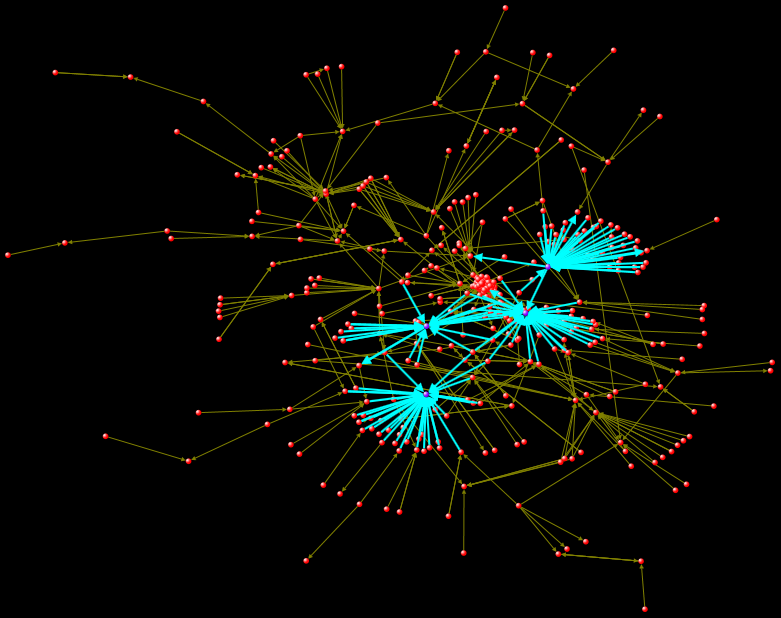
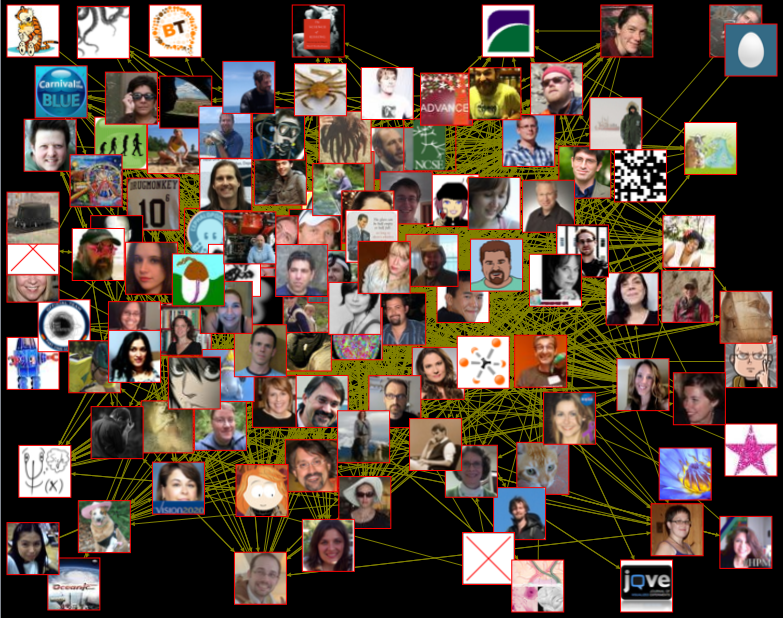
This graph reflects “Mentions” and “Replies-to” relationships in tweets with the #scio11 hash tag on 20110117, “following” data has also been harvested. Don’t see your avatar here? That’s because there are over 330 twitter users in this image and the canvas size isn’t large enough to display all their avatars, those who posted the most tweets are buried under a mountain of other individuals in the center of the image. Even trying to pull the network apart by hand, I was still unable to reveal anywhere near the number of users actually participating in the network.
#scio11 Hash Tag Explosion
(Click to Enlarge)
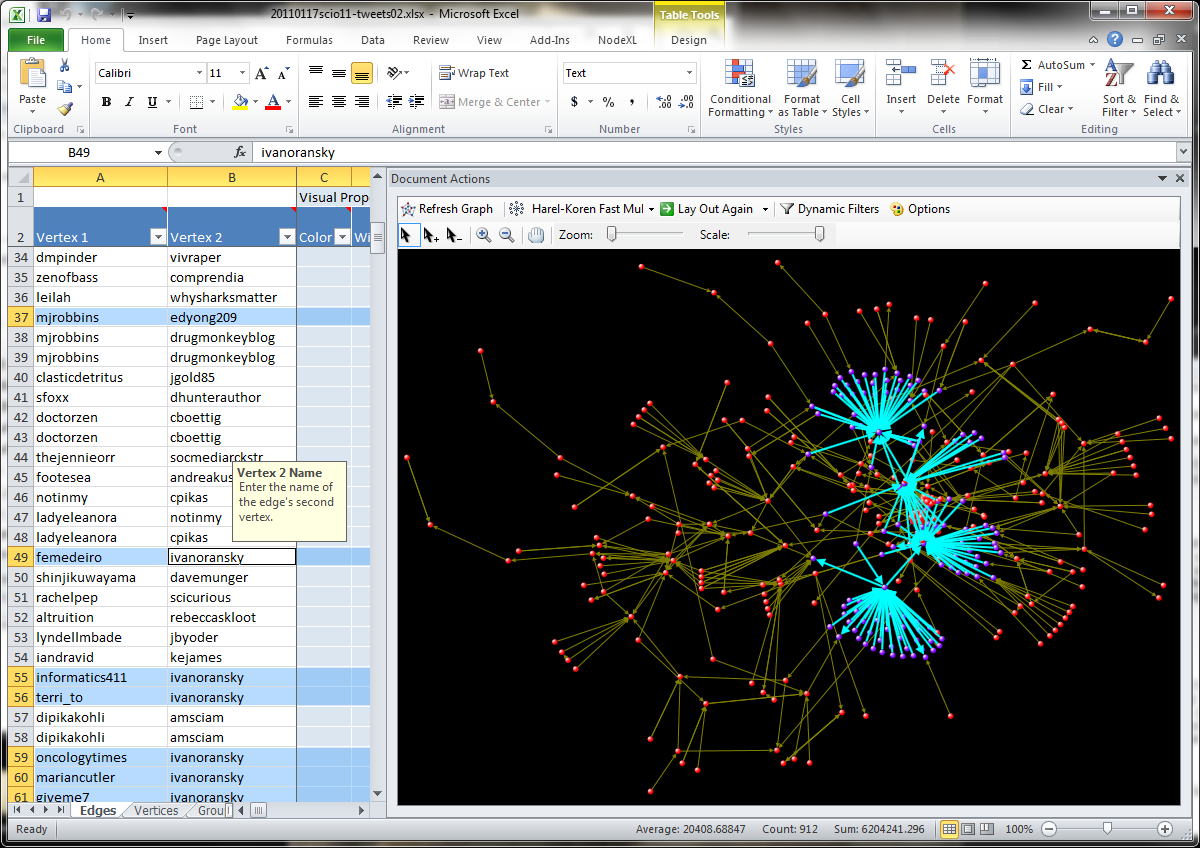
This is a very important point: as the size of the social network grows, NodeXL becomes less useful for producing nifty images of the network; however, NodeXL remains very useful as an interactive tool for exploring the data you harvest. For example, I expected BoraZ, mistersugar, ktraphagen, and scio11 to be important vertices in the Science Online Tweet network, but I also discovered two other key players by exploring the below graph: edyong209 and ivanoransky.
BoraZ, MisterSugar, scio11, EdYong, and ivanoransky Highlighted
(Click to Enlarge)
NodeXL also provides means to Filtering by relationship date, number of followers, number of tweets, tweet date, and joined twitter date… among others. I experimented with a simple X and Y vertex filter to reduce the number of results in my graph.
#scio11 Hash Tag Filtered
(Click to Enlarge)
Other Science Online tags you might want to try harvesting from twitter are #techwild, #huggedbora, #sciophoto, #altmetrics, #opensci, and #drunksci. You’ll get fewer, more manageable results, and might find a tag of more specific interest to you regarding the conference.
#scio11 Filterd to Just BoraZ, MisterSugar, and Scio11
(Click to Enlarge)
You can also filter by clicking on the column headers in the spreadsheet, unchecking “Select All” and then checking just those twitter users you want to see results for. In the above graph, I have filtered my results to just BoraZ, MisterSugar, and scio11. You can filter your results down to just yourself, in what I suppose would be called “Ego-Filtering” (ala “egosurfing“).
Getting Started with NodeXL
Installation
You can download NodeXL from Microsoft’s Codeplex at codeplex.com/NodeXL. You’ll need to have a version of Excel equal to or greater than the 2007 version. Download the ZIP file, unzip it, make sure Microsoft Excel is closed, and run the Setup.exe file (you can then delete the zip files). NodeXL works as an Excel Template, and you can access it via Start > All Programs > Microsoft NodeXL > Excel 2007 Template. This will open Microsoft Excel with a “NodeXL” menu option and graphing area.
NodeXL
(Click to Enlarge)
Harvesting Your Facebook Network
A fun way to get started with NodeXL is to analyze your Facebook network. As I demonstrated earlier, you’ll find that your friends naturally group into clusters around the different areas of your life: work, family, friends, etc. The first thing you’ll need to do is download your Facebook friend data as an XML file using the Name Gen Web app accessed via apps.facebook.com/namegenweb and choose to download the NodeXL graph after accepting the application. When Name Gen Web has generated the data for your network, right-click the link and “Save as…” it to your computer.
Once you have this file, open NodeXL from the template, select Import > From GraphML file and open the file you saved from Name Gen Web. Click “Read Workbook” to have NodeXL process the vertices and render your network.
Harvesting Twitter Feeds
Warning: because Twitter limits the amount of data you can harvest each hour, it can take a very long time to collect your results. Another warning is that, for a hash tag like #scio11, the data set is large enough that your computer will grind to a crawl as you explore it. Make sure you are not checking twitter via another application as you harvest data to prevent your IP address from maxing out your access to the service. You might try Requesting Whitelisting for your IP; although, twitter didn’t respond to my request and most people don’t have a static IP anyway.
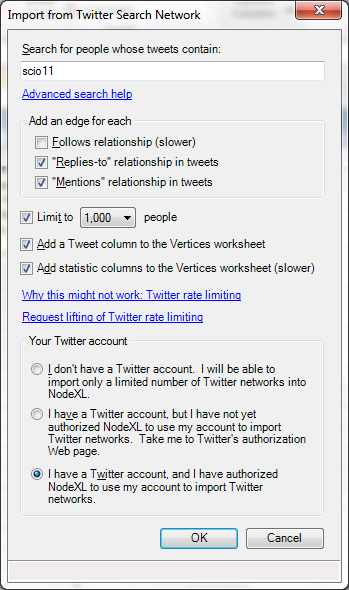
Import from Twitter
All that being said, you can download the scio11 NodeXL data below (right-click and “Save as…”):
- 2010-11-15 scio11 Twitter NodeXL data
- 2011-01-17 @ 0738 scio11 Twitter NodeXL dataset
- 2011-01-17 @ 1507 scio11 Twitter NodeXL dataset
- 2011-01-17 @ 1624 scio11 Twitter NodeXL dataset
One thing I learned today while harvesting data is that timing is important. Although tweet histories have no limit on how far back in time they go, NodeXL will only harvest at most 500 tweets into the past. So when I got flagged for DoS Sunday night after the conference, and could not successfully harvest data until the next day, I lost access to many of the tweets made during the conference, especially when you consider there were 9,490 tweets, 1,214 contributors, and 1,355.7 tweets per day using the tag.
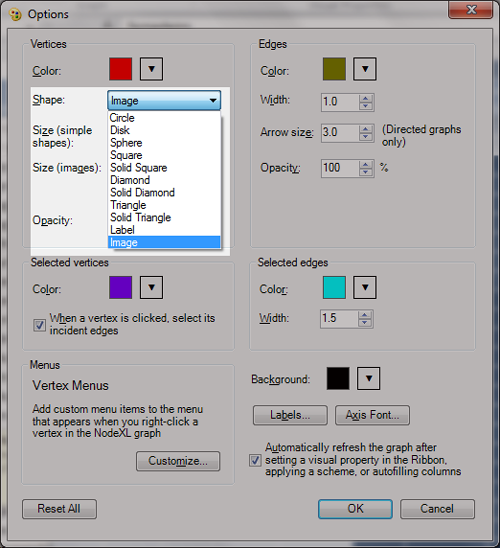
Add Twitter Avatars to Your Graph
One finale note, it’s nifty to add Twitter Avatars to your graph. So to accomplish this, in the graph window click on Options and select “Images” from the Vertices > Shape dropdown.
Going Deeper
Analyzing Social Media Networks with NodeXL
(Click to Enlarge)
If you’re interested in learning more about NodeXL’s possibilities and features, I highly recommend Hansen, Shneiderman, and Smith’s excellent book Analyzing Social Media Networks with NodeXL: Insights from a Connected World, which not only provides step-by-step instructions for making the most of the tool, but also provides a great deal of background on the emerging science of Social Network mapping.
If you have questions or need support getting features working in NodeXL, please ask in the comments section. I’m happy to oblige.
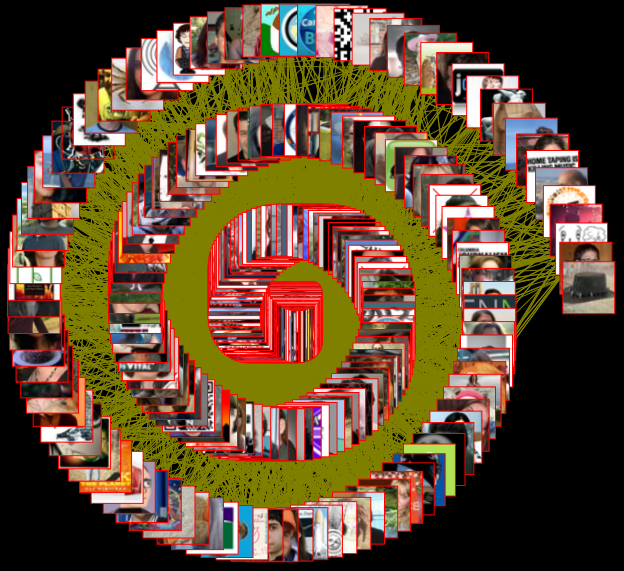
Scio11 Twitter Hash Tag, Spiral Graph
(Click to Enlarge)
Update:
The authors sent me some additional links to NodeXL resources. Great stuff!
Learning by Doing with NodeXL
Comments
2 responses to “Social Network Mapping Fun with NodeXL and Science Online 2011”